In the world of stock trading, investors are often bombarded with conflicting advice: "buy the dip," "catch the falling knife," or "wait for a market correction." While these strategies may work in specific scenarios, one timeless principle consistently stands out as a cornerstone of successful investing: buy stocks in uptrends. An uptrend—defined as a sustained period of rising prices, characterized by higher highs and higher lows—is not just a technical pattern; it’s a reflection of underlying strength and market confidence. Here’s why focusing on rising channels can significantly improve your investment outcomes.
What Is an Uptrend? More Than Just "Going Up"
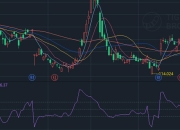
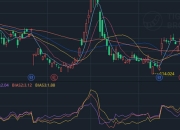
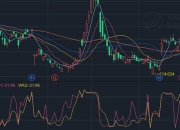
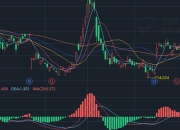
Before diving into the benefits, it’s crucial to define an uptrend clearly. In technical analysis, an uptrend is a series of price movements where each peak (high) is higher than the previous one, and each trough (low) is also higher than the last. This creates a "rising channel" bounded by an upper trendline (connecting the highs) and a lower trendline (connecting the lows). Think of it as a stock climbing a staircase: it may pause or retrace slightly (a minor dip), but the overall direction is upward.
For example, a stock moving from $50 to $60, then dipping to $55 before rising to $70, and pulling back to $65 is in a clear uptrend. The key is the consistency of upward momentum—supported by increasing buying pressure and positive fundamentals.
Reason 1: Uptrends Reflect Strength and Confidence
A stock in an uptrend is not rising by chance. It’s typically backed by strong fundamentals: rising earnings, growing market share, innovative products, or favorable industry trends. These factors attract investors, driving demand and pushing prices higher. When a stock is in an uptrend, it signals that the market "believes" in its story—whether it’s a tech disruptor, a healthcare leader, or a consumer goods giant.
Consider the early days of companies like Apple or Amazon. Their stocks entered sustained uptrends as they revolutionized their industries, and investors who bought into these trends early reaped massive rewards. Uptrends, in short, are the market’s way of saying, "This company is doing something right."
Reason 2: The Power of Momentum: "The Trend Is Your Friend"
One of the oldest adages in trading, "the trend is your friend," holds true because momentum tends to persist. In an uptrend, positive feedback loops form: rising prices attract more attention, leading to more buying, which pushes prices higher still. This momentum can last for months or even years, allowing patient investors to capture substantial gains.
Contrast this with a downtrend (a "falling knife"), where negative momentum can be self-reinforcing: falling prices trigger panic selling, leading to further declines. Trying to "catch a bottom" in a downtrend is risky—no one can predict exactly when a stock will stop falling. In an uptrend, however, the risk of a major reversal is lower, as the dominant force is buying, not selling.
Reason 3: Better Risk-Reward Ratios
Buying in an uptrend improves your risk-reward profile significantly. When you purchase a stock in a rising channel, you can define your risk more clearly: the lower trendline of the channel acts as a natural support level. If the stock pulls back to this level and bounces, your thesis is validated; if it breaks below, you can exit with a predefined stop-loss, limiting your losses.
For example, if a stock is trading in an uptrend between $60 (support) and $80 (resistance), buying near $60 gives you a clear upside target (approaching $80) and a defined downside risk (a break below $60). In a downtrend, by contrast, the "reward" is a potential reversal (which may never come), while the "risk" is an extended decline—a scenario with poor risk-reward symmetry.
Reason 4: Higher Probability of Success
Statistically, stocks in uptrends are more likely to continue rising than to reverse. Studies of historical market data show that trends—once established—tend to persist. A 2019 analysis by the Journal of Finance found that stocks in the top 20% for momentum over the past 6-12 months outperformed other stocks by an average of 8% annually over the next decade.
This isn’t to say uptrends are immune to volatility—they will always have minor pullbacks. But these dips are often buying opportunities within the larger trend, not signs of a reversal. By focusing on uptrends, you align your investments with the higher-probability outcome: continued upward movement.
How to Identify and Trade Uptrends
To apply this strategy, start with technical analysis:
- Trendlines: Draw a line connecting the higher lows (lower trendline) and higher highs (upper trendline) to confirm the uptrend.
- Moving Averages: Use the 50-day or 200-day moving average; a stock trading above these averages is generally considered in an uptrend.
- Volume: Look for increasing volume on upward moves and decreasing volume on pullbacks—this confirms buying pressure is dominant.
- Breakouts: Wait for the stock to break above resistance (the upper trendline) with high volume to enter, as this signals the uptrend is strengthening.
Combine technical analysis with fundamental checks: ensure the company has solid earnings growth, a competitive moat, and positive industry tailwinds. A stock in a technical uptrend with weak fundamentals is a red flag—strength must be supported by real business performance.
Conclusion: Why Uptrends Beat "Timing the Market"
Many investors try to "time the market" by buying low and selling high, but this is notoriously difficult. Uptrends offer a simpler, more reliable approach: instead of predicting bottoms, follow the momentum. By focusing on stocks in rising channels, you align yourself with the market’s dominant force—buying pressure—and increase your odds of capturing sustained gains.
Remember, even the best stocks experience downtrends. The key is to recognize when a stock is in a healthy uptrend and stay with it until the trend shows signs of breaking. As the saying goes, "You don’t have to catch the entire move—you just have to catch part of the trend." In investing, that trend is often the difference between average returns and life-changing wealth. So next time you’re analyzing stocks, ask yourself: Is this in an uptrend? If the answer is yes, you may have found your next big opportunity.
版权声明
本文仅代表作者观点,不代表本站立场。
本文系作者授权,未经许可,不得转载。